Luciana Sanches, Marcelo de Carvalho Alves, and Camila Silva Franco
Short presentation
The Bandiagara II Village is part of the Zangasso commune in the Cercle of Koutiala in the Sikasso region of southern Mali. Basically, it is composed of desert and semidesert areas, which has a well-defined climatic seasonality with a marked drought.
Some tribes live in the Bandiagara II Village, one of them is the Dogon of Bangadiara II. On February 15th, accompanied by a native of the tribe, we walked around the perimeter of the Dogon tribe’s home in Bandiagara II, recording the route on a hiking line with GPS tracks using a Garmin Forerunner 235 (https://www.garmin.com/pt-BR/p/529988), according to figure 1, in which the top part shows the route in the satellite layer, the left in the map layer and below the route in the elevation (m). These files were downloaded from Garmin Connect app (https://www.garmin.com/pt-BR/p/125677). Simultaneously, georeferenced photos were recorded using the Iphone 12 mini smartphone with the GPSMapCamera app (https://gpsmapcamera.com/) (See figure 2).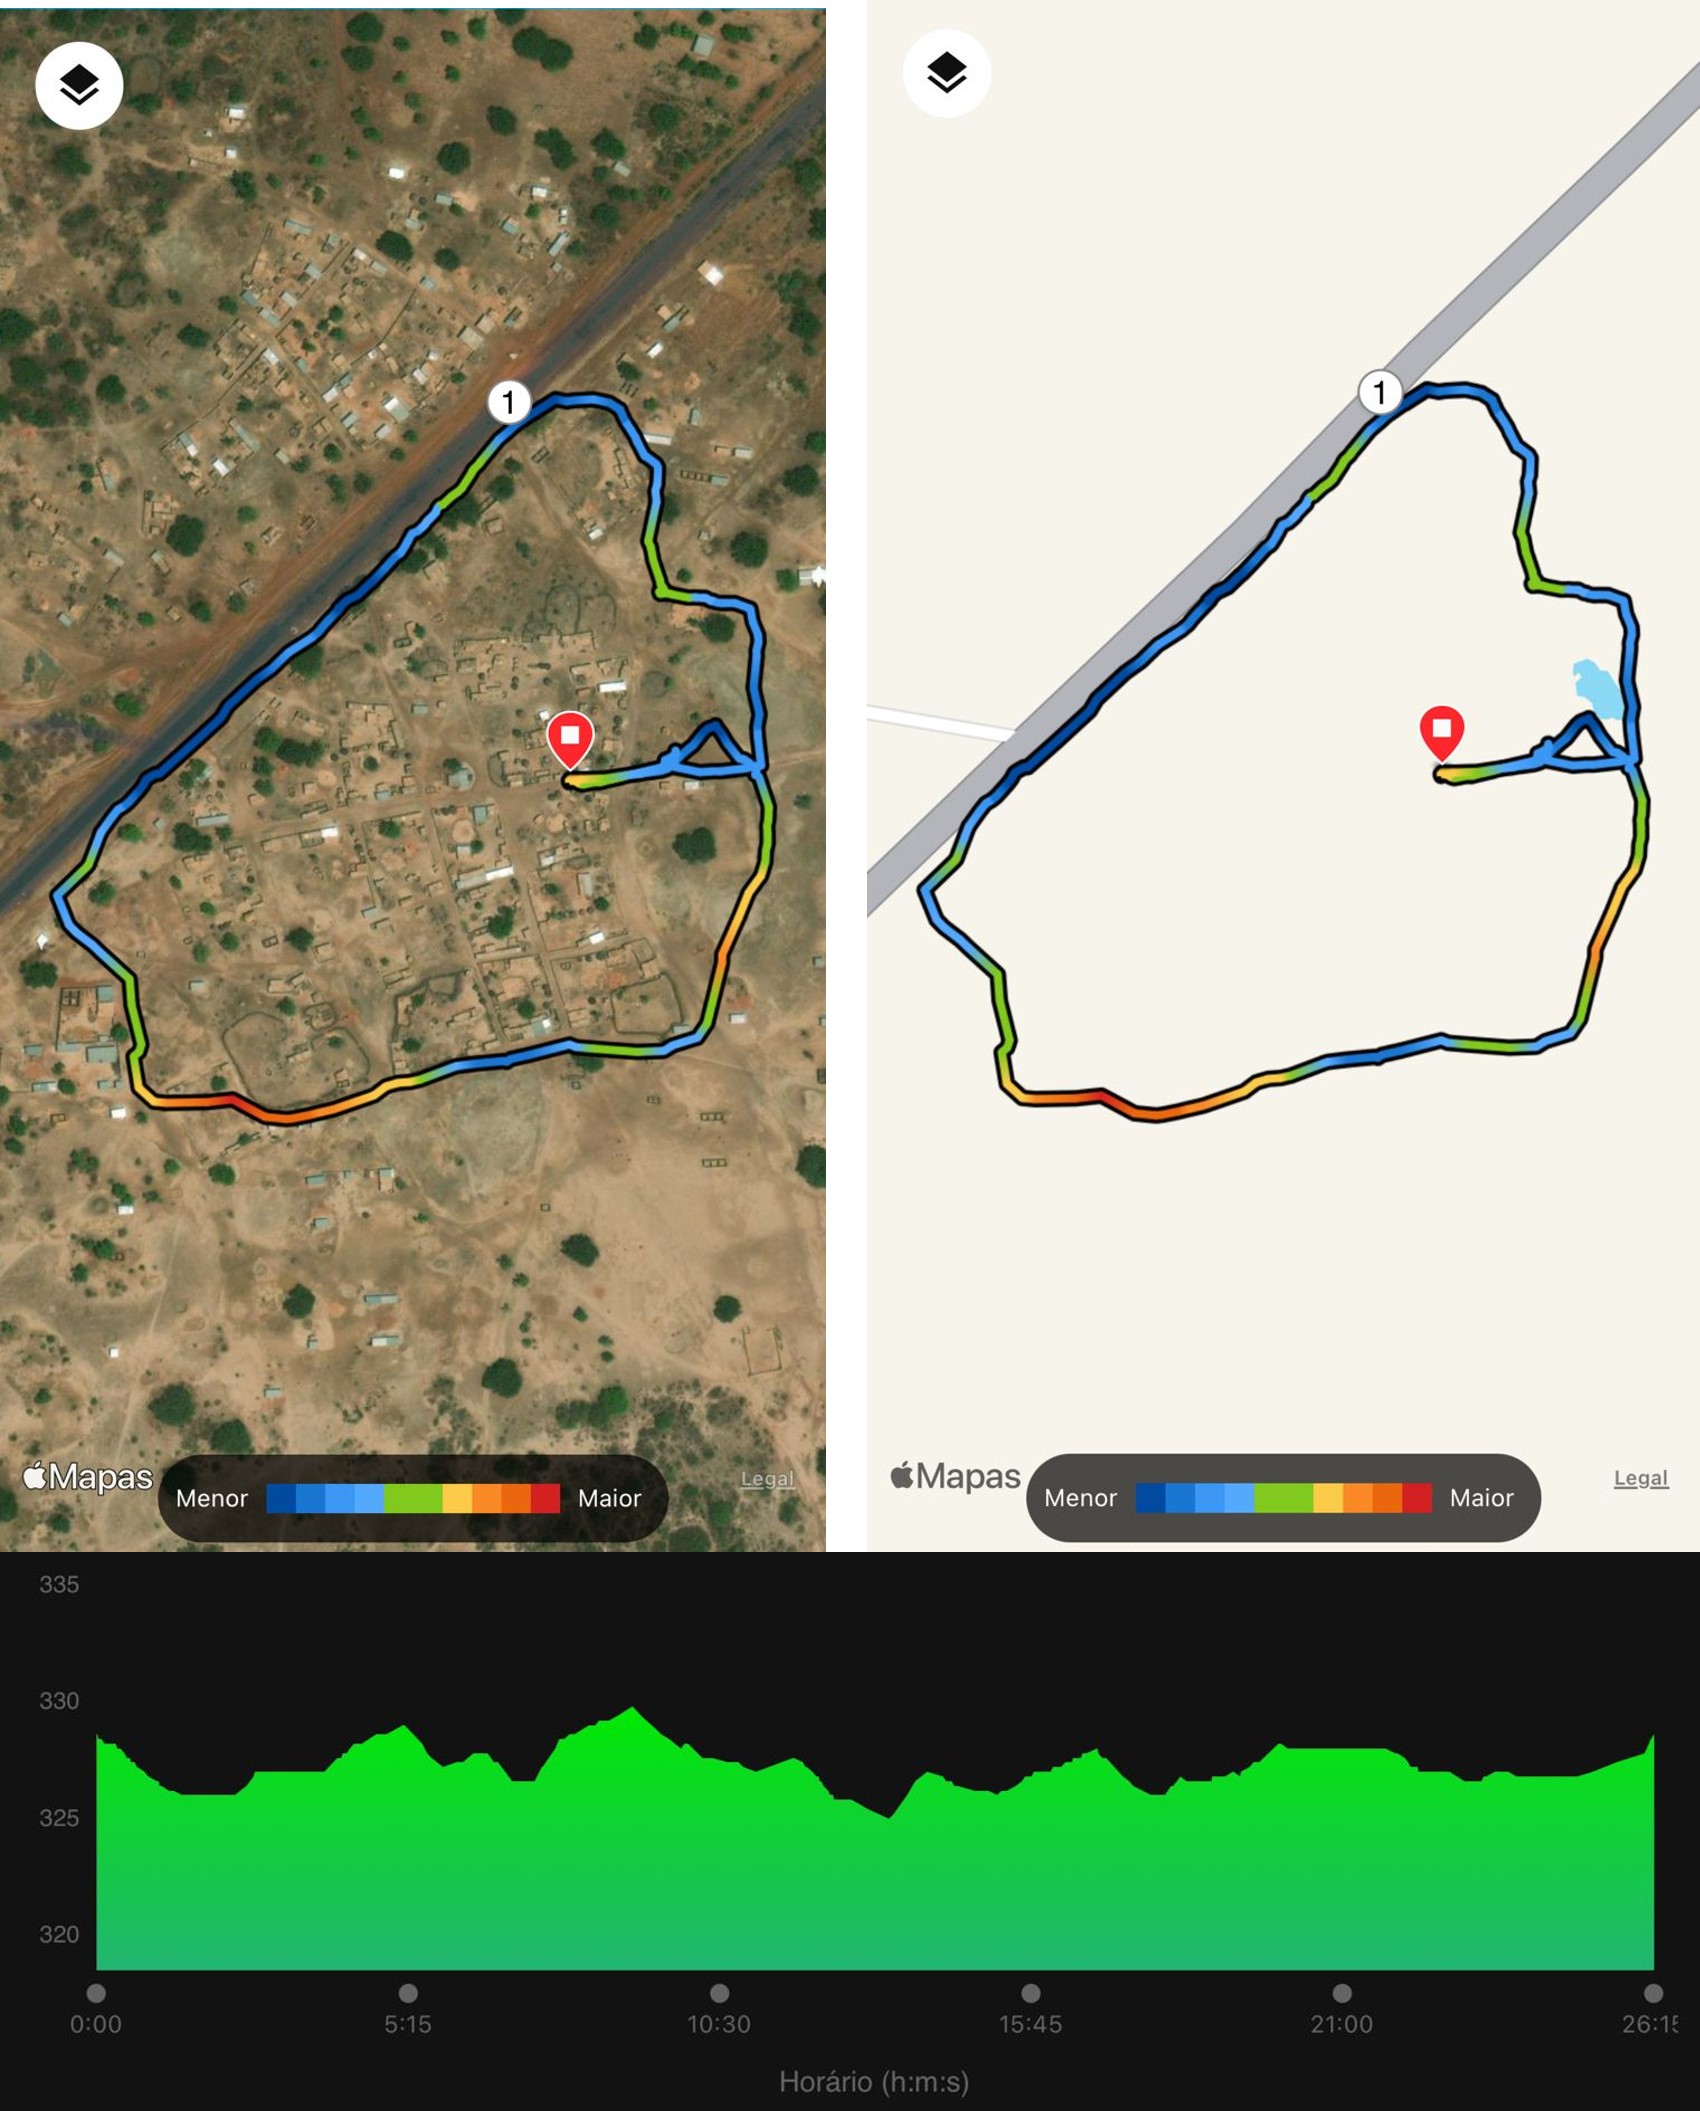
Figure 1: Route on a hiking line, top left in satellite layer, top right in satellite layer, and below the elevation map.
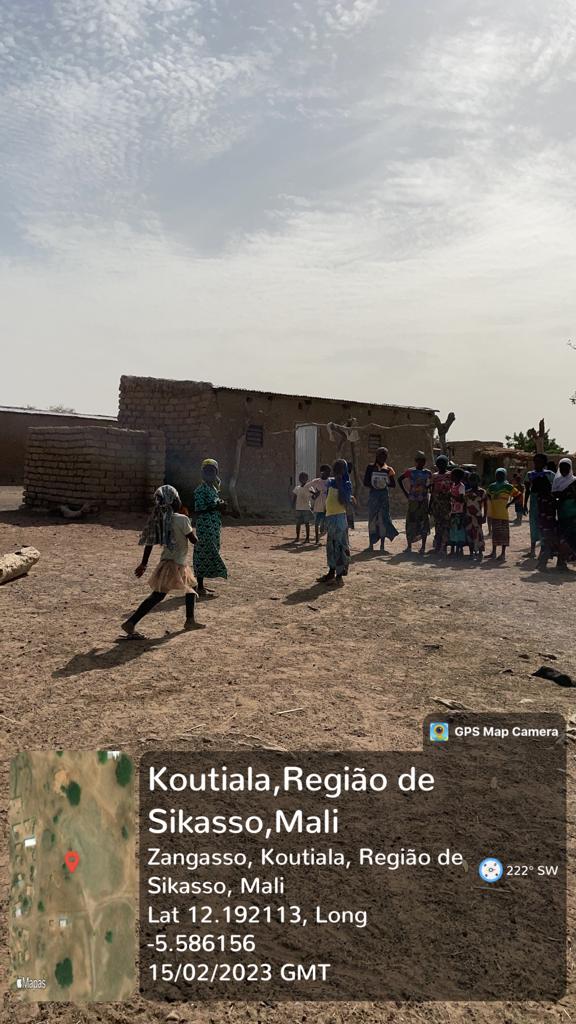
Figure 2: Geotagged photograph illustration Bandiagara II Village central area.
R software (https://www.r-project.org/) and R packages were used in this application. In general, packages: dplyr (Wickham, François, et al. 2022), ggplot2 (Wickham, Chang, et al. 2022), leaflet (Cheng et al. 2021), leafpop (Appelhans and Detsch 2021), lubridate (Spinu et al. 2021), purrr (Wickham, Henry, and RStudio 2023), readr (Wickham et al. 2023), sf (Pebesma et al. 2022), tibble (Müller et al. 2022), tidyr (Wickham and RStudio 2020), exifr (Dunnington and Harvey 2021), and anytime (Eddelbuettel 2020). R and Rstudio enabled data processing, analysis, and also the elaboration and dissemination of this project.
The databases of the georeferenced route and the geotagged photographs were joined, and an interactive map was created. The interactive map can be accessed over the OpenStreetMap.France world map layer (https://www.openstreetmap.fr/) or Esri.WorldImagery satellite imagery base map (https://www.esri.com/en-us/arcgis/products/imagery-remote-sensing/capabilities/content), as examples in the figures 3 and 4, respectively.
Georeferenced photographs have the potential to recognize in fieldwork the information about relief variation, land cover and land use, interactions between residents and the RN11 road, interactions between neighboring tribes, the use of building elements and their surroundings, and finally, exploring the potential to reveal areas of interest and their underlying spatio-temporal dynamics.
The expectation of this work is to increase people’s quality of life, with health and sanitation, and consequently increase the development of work in the field.
- Explore the interactive surveying in the web: click here
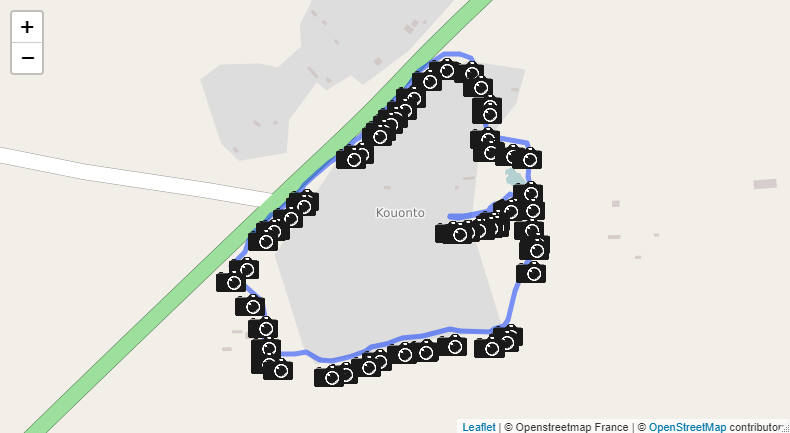
Figure 3: Interactive web mapping illustration over the OpenStreetMap.France layer.
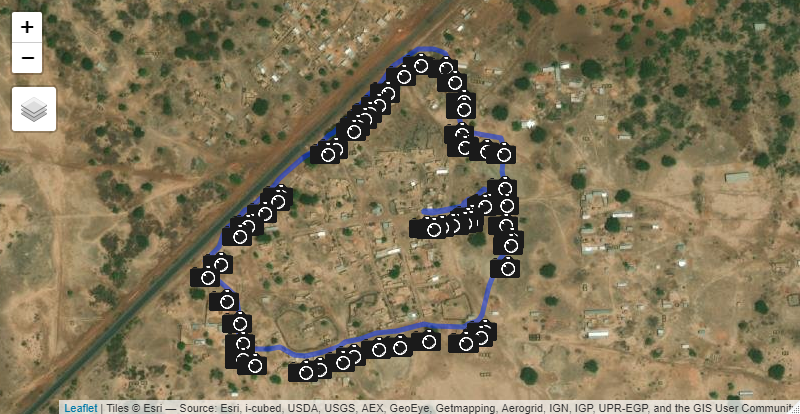
Figure 4: Interactive web mapping illustration over the Esri.WorldImagery layer.